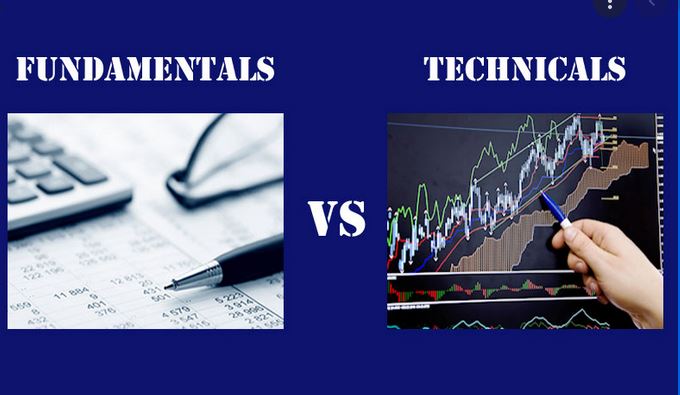
Teknîkî li hember Bingehîn: Ya çêtirîn çi ye?
Bingehîn û analîzên teknîkî are the two major bodies of trading literature. With these two bodies, traders can make informed investment decisions to gain profitable results. Thus, it enables the investor to decide whether to hold, buy or sell any asset in a regulated market.
To help you differentiate between technical and fundamental analysis, we have a quick guide for you and a comparison chart for a better understanding.
What is meant by technical analysis?
Technical analysis is generally based on the volume data or asset’s price. Its main objective is not just to predict the coming future but also to identify certain similar scenarios.
Price action is utilized as the indication related to how the market participants were acting in the past and how they will act in the future.
Technical experts can use trends, chart patterns, price, volume behavior, and support & resistance levels to identify upcoming trading opportunities.

What is fundamental analysis all about?
Ger em qala wê bikin analîzek bingehîn, it is a method used for the company’s evaluation and figuring out the intrinsic value of its stock. Companies are generally valued as if they were completely unlisted in which no market prices are involved.
Selling and buying decisions are made if the stock is traded at a premium or discount value. Thus, a trader can also apply this analysis to other markets such as commodities and currencies. In this situation, any factor affecting the asset value is yet considered.
Which tools are used for technical and fundamental analysis?
In the fundamental analysis, different tools are used by the analysts, which include economy, competitor, and the market in which they are operating.
For stocks, an important source of data is a company’s financial statements, which include cash flow statements, income statements, or balance sheets.
On the contrary, different charts bihayê are used in technical analysis, including bar charts, line charts, or candlestick charts. Based on the price charts, tools can somehow vary widely.

Comparison between technical vs. fundamental analysis
| Bingeha berhevdanê | Analîzek bingehîn | analîzên teknîkî |
| Ji bo Best | Long term investments | veberhênanên demkurt |
| Karan dike | Investing | Trading |
| Karê sereke | Identifying the intrinsic stock’s value | Identify when is the best time to exit or enter a market |
| Focus | Past and present data | Only past data |
| Forms of data | News events, economic reports, and industry statistics | charts |
| Trader’s type | Long term position trader | Short term trader and swing trader |
| Biryara | Decisions are made through the information available and the latest statistics evaluated. | Decisions are made through the latest market trends and upcoming prices of stock. |
ramanên Final
To end with the discussion, for investing in an unlisted company, choosing fundamental analysis is something that can work best for you. You can learn a lot from the trading history of fundamentals for the listed stocks. In short, in the fundamental analysis, any investor can buy a stock when the stock price is a bit lesser than the intrinsic stock’s value. But in technical analysis, any trader can buy stocks when they know that they can sell them at a higher price.
« Meriv çawa bazirganiya nûçeya Forex-ê xweşbîn dike? Meriv çawa di Analîza Teknîkî de Zehmetiyên xwe baştir bike? »